Left Toolbar > ![]() Value Nodes >
Value Nodes > ![]() Value Range node
Value Range node
The Value Range node returns a smooth region around a value.
input
 image
VALUE image. Min: 0.0. Max 1.0.
image
VALUE image. Min: 0.0. Max 1.0.
output
 image
VALUE image. Min: 0.0. Max 1.0.
Range around center 0.5 with size 0.1 and falloff 0.1.
image
VALUE image. Min: 0.0. Max 1.0.
Range around center 0.5 with size 0.1 and falloff 0.1.
On the left toolbar choose Value Nodes > Value Range. ![]() >
> ![]()
Drag the Value Range icon into the Node Graph.

Adjust the attributes of the Value Range node.
image An image.
Note. If the input image is not of VALUE color mode, it is converted to value color mode using the default settings.
image An image of VALUE color mode.
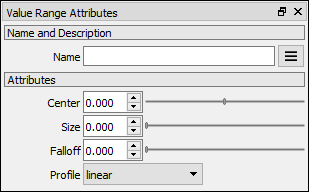
Center
The center of the range region.
Size
The size of the range region.
Falloff
The falloff of the range region.
Profile
The profile of the range region.